Creating, configuring and downloading reports
Published 08 March 2018
What can be included in reports?
SQL Monitor supports two types of tiles that you can include in reports:
Summary tiles
These are a set of predefined reporting tiles:
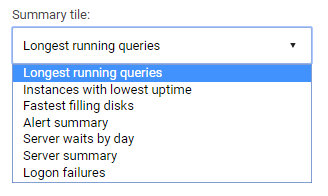
Queries using most CPU worker time
Shows the longest running queries across your estate.
- Instances with lowest uptime
- Shows the top 5 SQL Server instances with lowest uptime across your estate.
- Fastest filling disks
- Shows the top 5 logical disks across your estate that are most likely to run out of space.
- Alert summary
- Shows a breakdown of alerts for the current and previous periods by severity (High, Medium and Low) and alert type.
- Server summary
- Show summary information about the SQL Server instance and host machine
- Server waits by day
- Shows SQL Server waits for the top 5 SQL Servers with the highest cumulative waits over the report period.
- Logon failures
- Shows the top logon failure messages recorded in the error log over the report period.
- Job failures
- Show total number of job failures and most frequent job failures
- Server unreachable events
- Shows total downtime for all and a breakdown of affected servers
Analysis tiles
These tiles can be created from anything that can be shown in the Analysis graph (including custom metrics) over the time period of the report. See Displaying metrics on the analysis graph.
Creating a report
Navigate to the Reports tab.
Tap the
 button and the "Add Report" dialog should appear:
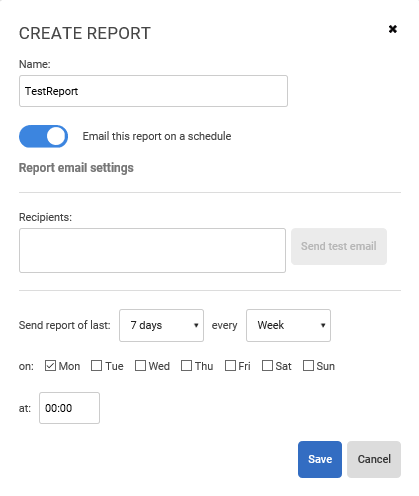
Enter a report name and select whether you would like the report to be emailed automatically
- Enter the recipients to whom you wish the report to be emailed
- (Optional) Send a test email to check the validity
Select the period you would like the report to cover
Enter when you would like the report emailed to you, the frequency of the emails and the email recipients. See Scheduling emailed reports for more information about emailing reports
Click the "Save" button
Adding a chart/tile
Tap the
 button and the "Add Tile" dialog should appear:
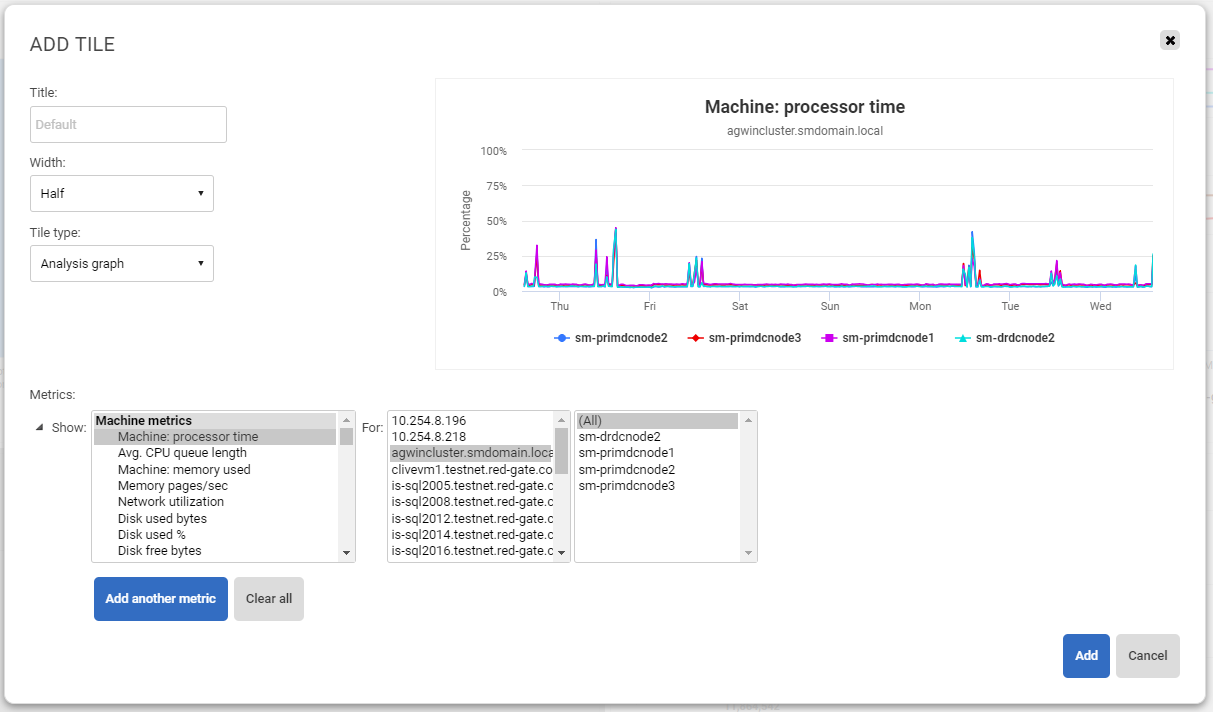
(Optional) Enter a custom title for the tile.
Choose the screen width of the graph. The following widths are available:
- Full
- Three quarter
- Two third
- Half
- Third
- Quarter
Choose the tile type. The following types are available:
- Analysis graph
- Summary tile
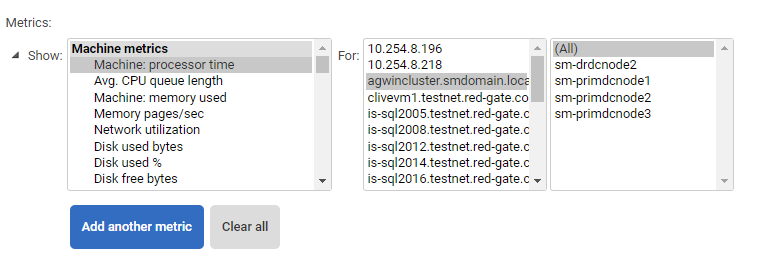
If the Analysis graph is chosen, select the metrics using the metric selector:
If the Summary tile is chosen, choose from the available summary tiles:
Click "Add" to add the tile to the report.
Editing, moving and deleting a chart/tile
Click the
 button at the top right of the tile.
 A dialog menu should appear with the following options:
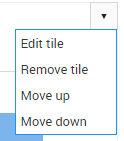
Edit tile will bring up the edit dialog.
Remove tile will delete the tile from the report.
Move up will move the tile up one place.
Move down will move the tile down one place.
Editing, deleting and downloading a report
- Click the
 button next to the report name selector.
 - A dialog menu should appear with the following options:
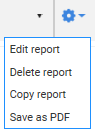
- Edit report will bring up the edit report dialog.
- Delete report will delete the current report and any associated email schedules.
- Copy report to make a new report with a different name
- Save as PDF will let you download the current report as a PDF.
This documentation contains proprietary information and is protected by copyright law.
Copyright © 2026 Red Gate Software Limited. All rights reserved


