Opening methods in Visual Studio
Published 17 September 2018
Switching to your source code from ANTS Performance Profiler
To identify classes with source code, you must ensure that the .pdb file is in the same directory as the application. For more information, see Troubleshooting PDB problems.
You can switch to source code from the call tree or the methods grid. In both views Classes with source code are shown in bold.
To search for your class's namespace, on the Tools menu, click Find.
Right-click a class with source code to show the context menu.
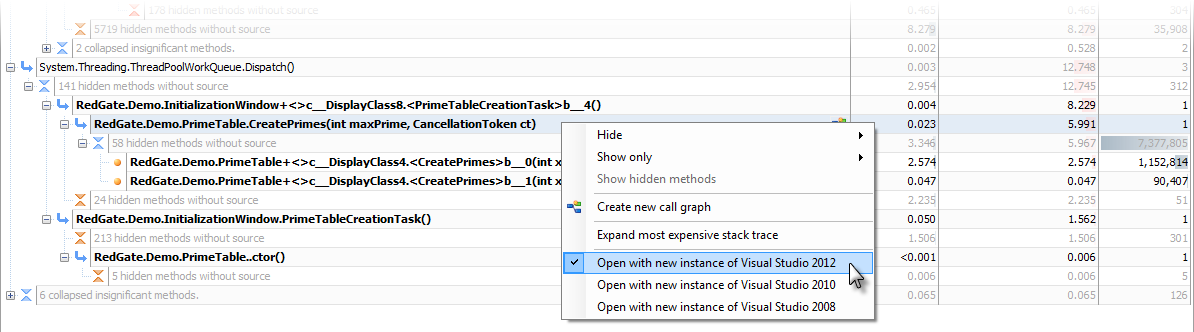
To open only the source code associated with that class, select Open with new instance of Visual Studio 20xx.
It is often more useful to open the source code inside its solution. To do this, open the solution in Visual Studio. Return to ANTS Performance Profiler and open the context menu. On the context menu, select Open with (Solution Name) - Microsoft Visual Studio (Visual Studio 20xx).
Troubleshooting
- If the path to the source code in the .pdb file is invalid, the class is still shown in bold, but the context menu does not display the Visual Studio options. Recompile the application on the computer you are using to profile it.
- If the solution was opened with elevated privileges (Visual Studio is running as administrator), the option for opening the source code inside the solution might not be shown. Restart Visual Studio under the same credentials as ANTS Performance Profiler.
This documentation contains proprietary information and is protected by copyright law.
Copyright © 2026 Red Gate Software Limited. All rights reserved


