Overview of SQL Monitor and its design
Published 07 October 2020
"If you collect and examine individually five separate pieces of performance data, it's possible that each could send you down a separate path. Viewed as a group, they will likely lead you down the sixth, and correct, path to resolving the issue" – Jonathan Kehayias, Troubleshooting SQL Server: A Guide for the Accidental DBA
There are two main roles for SQL Monitor: spotting a problem as early as possible and providing enough evidence to allow a user to determine the cause of it and figure out the remedy.
The two roles go naturally together. It is little use knowing that a CPU is suddenly running at close to maximum capacity, or that disk IO bandwidth is saturated, without having the information to put it right. All RDBMSs, including SQL Server, have well-known diagnostic tools to help with the gathering of detailed evidence, but to react quickly and effectively you first need to know the general nature and context of the problem, and then to view the detailed metrics, as a group.
SQL Monitor aims to provide both the context of a problem, and the coordinated, "group view" of the server and database metrics. The Base Monitor provides to the GUI, simple perspectives, summaries and views of activity, from the broad landscape of groups or clusters of servers all the way down to the details, such as the wait statistics associated with queries on individual databases.
It analyses the metric and alert data to provide a detailed graphical view of resource usage, server and user activity and alerts over time, and allows users to correlate this information with the behavior of relevant performance counters and wait statistics. This is the best way to make sense of the often complex performance patterns that databases exhibit when under load, and so move down the correct path to resolution.
SQL Monitor uses overviews, projections and baselines to help you, not only to diagnose alerts quickly, but also to predict how database services will cope with expansion in use or increase in load. It will allow you to spot unusual usage patterns or worrying trends across any or all the monitored SQL Servers, and act before they escalate into problems that affect the service and integrity of the application.
SQL Monitor metrics
SQL Monitor monitors a comprehensive range of potential symptoms in each of its database servers. It collects a set of the most important standard SQL Server diagnostic metrics, at the machine, SQL Server and database levels (including Azure SQL databases and pools).
These metrics, when viewed over time, and in combination, will immediately narrow down the potential cause of an alert, and will help to diagnose CPU, memory or I/O queues and bottlenecks. It will help to understand the cause of query problems such as excessive 'blocking,' track disk space use, monitor backups and other scheduled jobs and respond quickly to common sources of SQL Server errors, such as deadlocks. It will even help resolve resource allocation issues in Cloud-based and VMware systems and troubleshoot delays and failures in High Availability systems.
As well as these built-in metrics that are relevant to general database activity, it makes sense to create simple SQL Monitor custom metrics, and associated alerts, to get application-level metrics, such as shopping-basket events, which you can correlate with activity and alerts in the database. This makes it much easier to fine-tune the monitoring strategy for the specific needs of application servers, the data they store, and the business processes they support.
SQL Monitor alerts
SQL Monitor raises an alert whenever the threshold conditions for the alert are breached. For example, it raises a high severity alert if a machine is unreachable for more than 30 seconds, a medium severity alert if CPU utilization is more than 90% for longer than 600 seconds, a low severity alert if a query runs longer than 10 minutes, and so on. It also raises alerts when certain SQL Server events occur, such as a deadlock or a job failure.
SQL Monitor provides sensible default threshold limits for each alert, but these are easily changed to fit the requirements of any server, or group of servers. The interactive timeline at the top of the Overviews page for a server shows when alerts were raised, within the context of server activity around that time.
A user who is logged in to the primary Base Monitor can see the list of alerts in the Alert inbox in the GUI, and they are usually also sent via email or over Slack messaging. SQL Monitor automatically groups alerts that relate to the same problem, such as the same long-running query, to prevent recipients being overwhelmed with too many individual alerts in the inbox.
Alert information is geared towards a "first-responder," but with enough supplementary information to lead the experienced investigator to the root cause. Each alert provides all the information required to determine an appropriate response. The alert details provide specialist diagnostic information for that alert type. For example, the alert details for a blocked query alert will contain the full blocking chain, and a Deadlock lock will provide the deadlock graph.
All alerts provide a range of performance data that includes a snapshot of machine and SQL Server metrics, system processes, and the "Top 10 queries," running around the time of the alert. So, for example, for a CPU utilization alert, we can quickly find the most CPU-intensive queries that were running, their query plans, any associated waits, and so on.
Configuring alerts
It easy to adjust the alerting strategy to quickly enable or disable alerts individually, adjust their thresholds, and determine notifications. You'll need to do this to fit the tool with the level of activity on the server, and the style of your monitoring activities and preferences.
Alert configuration can be manual, via the GUI, or automated using the PowerShell API. Using the API, you can "bulk apply" a finely tuned alerting strategy to a group of servers, which are likely to require the same alerts and thresholds, the same notifications and email destination addresses. Through the GUI, you can also suppress alerts, or just their notifications, during periods when they would be meaningless or a distraction, such as during maintenance windows.
Defining the destination of alerts
You can also configure who, or which channels, should receive certain alerts, and how. The obvious medium for alerts is email, though Slack messaging is also supported. To supplement these, SQL Monitor Alerts can be dispatched via webhook notifications. This allows integration with development and operations tools and can automatically generate tickets in service management systems such as ServiceNow, Microsoft Teams, Jira or ZenDesk, to help support a range of development methodologies.
SQL Monitor's Web Interface
Regardless of how many machines, instances and databases you must monitor, and where they are located, SQL Monitor is designed to offer a single view across all of them. When you open the web UI (see: https://monitor.red-gate.com/ for an example), you arrive at the Global Dashboard. It has six main "pages": Overviews, Alerts, Analysis, Reports, Estate and Configuration (covered in various sections of this documentation). Aside from this documentation, you can also view the Getting Started with SQL Monitor video course to get a detailed walk through of all these pages.
This section describes the intent and purpose of each page, and the information found on each one, for a user tasked with reviewing server activity and resolving issues.
Global Dashboard
The idea of the Global Dashboard is to provide users with a summary view of all monitored servers. This dashboard is most effective when servers are arranged into logical Server Groups.
It displays a matrix of tiles, arranged into your defined groups, with each one representing a SQL Server instance. The top band of the tile shows the name of the host machine, with different icons to represent different categories of server (Azure Machines, Availability Groups, and so on). The middle band shows the most severe current or recent alert raised on the server or cluster, color-coding the tiles red, amber or green, and so making it easy to see which instances require immediate attention. The lowest band of the tile shows a snapshot of waits, CPU consumption and disk I/O (reads and writes) in the last 15 minutes.
You can filter the tiles by alert severity, for example to focus on those that have recent high severity alerts, or by group, or by base monitor.
The following diagram shows two tiles at the top, as they appear on the Global Dashboard, and below them an illustration of the 2-node cluster that they represent, which hosts 8 Availability Groups (1 database per AG).

Server Overviews page
By clicking on the name of an instance, in its tile (or anywhere other than the colored alert band) you transfer to its Server Overview page, the detail window for that instance. This screen is the place to review any problems that arise, directly within the context of server activity over that period. It presents a timeline of alerts, resource usage, and waits, directly alongside important SQL Server and host machine performance counters, server and user processes, detailed query execution metrics, and more, all over the same period.
At top of this page is the activity graph, which plots the machine metrics and waits against an interactive timeline (x-axis). We can add baseline comparisons to the graph, in order to detect whether any of these metrics are behaving unusually.
The x-axis timeline is marked automatically with any alerts that fired during the displayed period (color-coded to indicate the severity of the alert). Via the PowerShell API, we can also annotate it with details of specific "events" that occurred on the instance, such as when a deployment occurred, or an ETL operation ran, and so on.
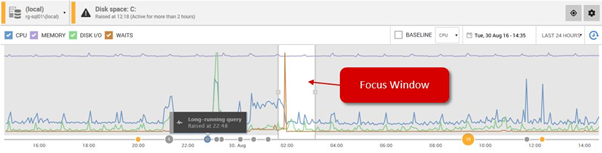
The graph has a calendar and a focus window, with "grab bars" to expand and contract it to the required period of investigation. When you do so, all the metrics and graphs you see as you scroll down the page will automatically update to reflect activity over the period determined by the graph.
The activity graph remains fixed as you scroll down the Overviews page, making it easy to correlate the alerts, events, and resource use patterns over that period, with all the metric graphs, lists, and properties that follow. Clicking on any metric graph automatically loads that metric onto an Analysis graph, for you to compare its behavior to other, related metrics.
Top 10 queries
We can correlate the activity graph with recorded queries over that period that were the principle resource consumers. Clicking on a query in the list reveals a host of query details:
SQL text, execution statistics (Execution count, Duration (ms), CPU time (ms), Physical reads, Logical reads, Logical writes, Database), graphical execution plan and plan handle, waits associated with the query, and a query history graph, showing any changes in plan over the period (captured from query store).
Top 10 waits
This list reveals the primary reasons why requests were being forced to wait, and for which resources. It shows a wait history graph, which plots the number of times or length of time (ms) a thread had to wait (per second), for each wait type detected, over the period. Below it is a list of information (captured from sys.dm_os_wait_stats) about the waits, as follows:
wait types, description, number of tasks affected by the wait type, wait time (ms), Avg. wait time (ms) and Signal wait time (ms).
Clicking on any wait type reveals a detail description, advice on how to investigate possible causes, and a list of queries affected by this type of wait, accompanied by query details, plans and query execution statistics, as described for Top 10 Queries.
SQL Server metrics
User connections and requests, latches and locks, buffer cache use and server properties.
Permissions
Windows, Active Directory and SQL membership of sysadmin, serveradmin and securityadmin roles.
Host machine properties and metrics
Network traffic, performance counters, operating system properties.
Disk usage
Space used, average read and write times, disk transfer rates.
Processes
This section details any blocking processes (top 10 by time), SQL Server user processes (top 10 by CPU), and a list of server processes (top 10 by CPU).
There is also a list of availability groups in this section.
Errors
A list of any recorded errors from the SQL Server error log.
Databases
Finally, you'll find a searchable list of databases, with database-level attributes (name and availability) and a sparkline of transactions per second and database size for each one. If you click on a database, you'll see a whole range of database-level metrics, properties and details of recent backups:
Database Size (data and log), log flushes, transactions, a backup history, details of the database files and a list of recent top queries.
Alerts page
This is the Alert inbox. You should regularly clear any alerts that have been resolved, or for which no current action is required or can be taken.
You can view alerts for a server group, subgroup, cluster, availability group, instance, or database. You can then filter alerts by severity level, status, and other properties (such as only unread or uncleared alerts), as well as by alert type and the time range in which the alert occurred.
When you open an individual alert, you go to the window that provides the details of the alert, with separate tabs detailing alert comments, alert history, occurrences and a description for the alert. The supporting performance data can help to provide a context for the alert you are seeing, with tabs showing for the following details over the period when the alert was raised:
- Host machine metrics, as timeline graphs: machine: processor time (%), avg. disk queue length, avg. CPU queue length, machine memory used (%), disk transfers/sec and memory pages/sec.
- SQL Server metrics, with timeline graphs for: avg. lock wait time (ms), buffer cache hit ratio {%), and user connections.
- System Processes lists the system process at machine level, including the WMI process, SQL Server processes, and any others.
- SQL Processes shows the system processes relating to SQL Server and the Trace events if this is enabled.
- Top Queries shows the QueryText, Execution count, Duration (ms), CPU time (ms), Physical reads, Logical reads, Logical writes, and the database on which the query was run.
Analysis page
The Analysis page provides the analysis graph. On this, we can plot the values for a group of performance counters that, when viewed together, will prove or disprove, for example, whether a system is memory-, CPU- or I/O-bound, over the specified time range. We can add any built-in or custom SQL Monitor metric, and by clicking on any metric graph, on the Overviews page or Alerts page, we automatically load that metric onto an analysis graph.
If you suspect that performance issues on a SQL Server instance over certain busy periods is caused by a buffer pool that is undersized for the workload, for example, then you might want to test this hypothesis by examining the behavior of a group of memory-related metrics, such Page Life Expectancy and others, over the slow periods.
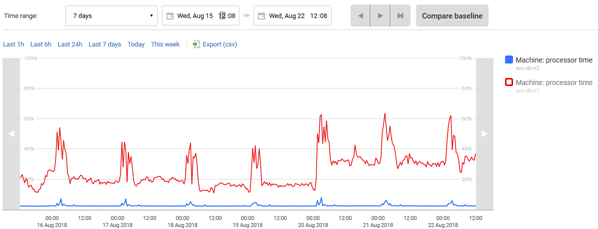
The Analysis graph also supports baseline comparisons, in order to detect whether any metric, or combination of metrics, is behaving unusually. For example, we can compare the behavior of the metrics, around the time that poor performance was reported, or a specific alert occurred, to the same period (2–4pm on Tuesday, say) for the previous 5 weeks. This makes it much easier to see what, if anything, changed.
The analysis graph is plotted using a series of data points that SQL Monitor collects at a set time frequency, depending on the type of metric. For example, Machine: processor time data is collected every 15 seconds. SQL Monitor plots a maximum of 500 data points on each graph (fewer for time ranges less than 10 minutes) and draws straight lines between consecutive points. Move your mouse pointer over any line to view the time and value of an individual data point.
Estate-wide overviews, trends and projections
SQL Monitor's Estate pages analyze data regarding installed versions, backups, disk space agent jobs, and SQL Server licensing, across every monitored server and database. The aim is to provide a clear picture of the overall health and security of all the monitored servers, and to understand not only current levels of use but also to see predictions of future behavior, based on current trends
- Installed versions – track all the different SQL Server versions, the latest update available, and its support status.
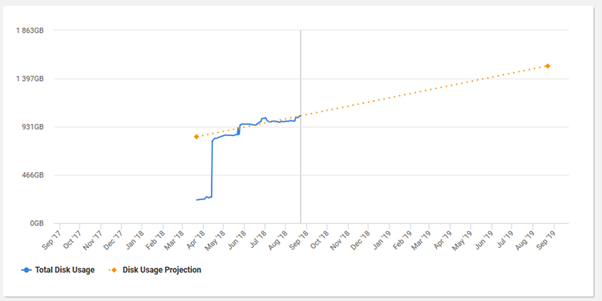
- Disk usage – track space use and predict when any disk volume might exceed its current capacity, based on extrapolation of the current rate of data growth.
- Backups – detect if any backup problems mean that current potential exposure to data loss for a database exceeds its agreed recovery point objective (RPO).
- SQL Agent Jobs – summarizes successful and failed job executions, with job details.
- SQL Server licensing – overview of the number of cores and the number of machines running SQL Server, by SQL Server version.
By spotting these issues quickly, you can take action that will avoid them escalating into the sort of problems that cause downtime, and unplanned maintenance work.
Reports page
SQL Monitor's Reports page provides a set of prepared reports that can be customized and scheduled so that you can communicate the status of your systems with management, the business, or anyone else who needs to know how well things are operating.
You can choose the end time for each report and the period over which to report (7 days, by default). You can also create new reports and edit existing reports, adding one of three types of report tile:
- Analysis – if preparing a report on your diagnosis of a serious performance issue, you can add an analysis graph tile.
- Summary – prepared summaries of information, including the instances with the least uptime, the fastest-filling disks, the servers and databases with the longest-running queries, alerts raised, their severity and type, and others.
- Alert – detailed reports on alerts, which you can filter on alert state, such as all currently active alerts, or specific alert types, such as recent "failed job" alerts. The alert report tile can use the report time range (last 7 days), or the time range defined for that type or status of alert, in an alert filter.
SQL Monitor administrators can assign users to the "Reports User" role to allow them to add, modify, and delete reports, but not take any further actions within SQL Monitor. See: Managing User Roles.
This documentation contains proprietary information and is protected by copyright law.
Copyright © 2026 Red Gate Software Limited. All rights reserved


