SQL Server instance overview
Published 05 December 2012
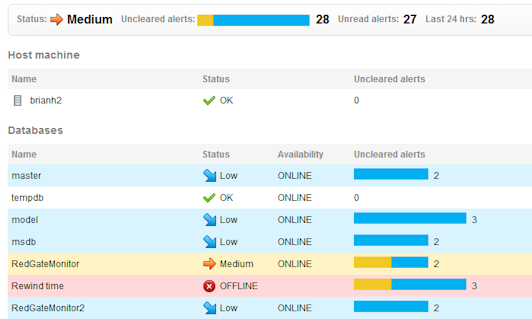
The SQL Server instance overview lists all the databases hosted on the instance and shows the status of each. Databases are listed in alphabetical order, with system databases listed at the top of the page:
- Click in the Name or Status column for a database to drill down to the overview page for the selected database.
- Click on the colored alert bar for a database to go to the Alert Inbox for all uncleared alerts relating to that database
- Click on Uncleared alerts, Unread alerts or Last 24hrs in the alerts summary panel at the top of the page to go to the Alert Inbox for all alerts relating to this SQL Server instance (and all its databases)
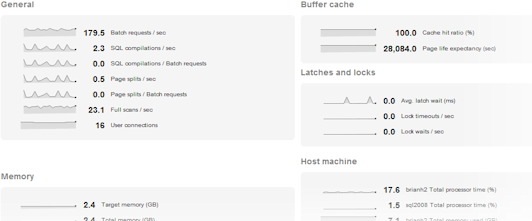
It shows various types of current information about the instance itself and and performance data for the last five minutes for a range of useful metrics. As for the other overviews, click on any sparkline graph to go to the Analysis page for that metric.
Top 10 expensive queries
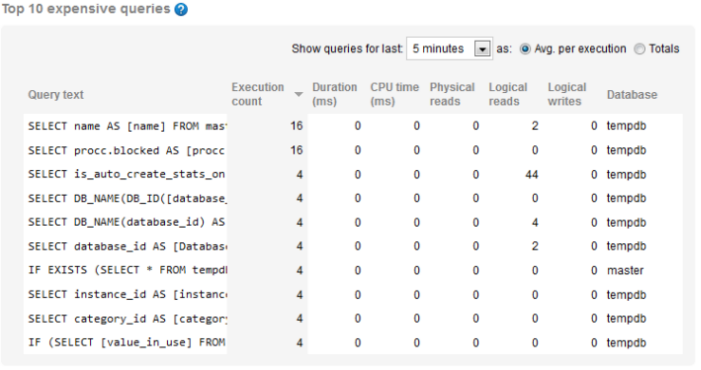
The SQL Server instance overview displays the top 10 queries that used the most resource over a selected period of time. This data helps you to evaluate the performance of queries and the efficiency of I/O usage and can be checked to see what queries were running around the time certain alerts were triggered.
Click on the query text to display the full query together with the identifier for the query plan from which it originates:
What data is displayed?
The following query data is displayed:
- Execution count - the number of times this query statement was executed. By default, queries are listed in descending order according to this metric.
- Duration - how long it took in milliseconds to execute the query.
- CPU time - how much processor time in milliseconds was used to execute the query.
- Physical reads - the number of times a page is read into the buffer cache. If the page is in the cache already, it uses the page already in memory and does not generate a physical read.
- Logical reads - the number of times the database engine requested a page from the buffer cache.
- Logical writes - the number of times data is modified in a page in memory. If a page stays in memory for an extended period, more than one logical write may be required before it is physically written to disk.
The database that each query was run against is displayed in the Database column.
Updating the list of queries
The data in the table is automatically updated every 60 seconds. You can also update the list as follows:
- Select a different time period from the drop-down list above the table. Time periods range from the last five minutes (selected by default), to the last three days.
- Click Totals to display queries based on total values.
- Click Avg. per execution (selected by default) to display queries based on average metrics over the time period selected. Note: This does not affect Execution count which always displays total values.
- Click on a different column heading to display queries based on that metric in descending order.


