Displaying the List of Code Analysis Issues
Published 29 October 2019
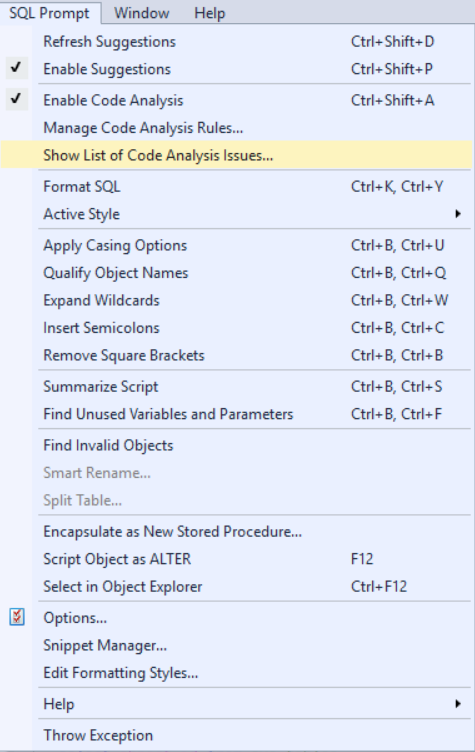
You can see the list of all issues in your script by going to the Prompt menu and selecting Show List of Code Analysis Issues...
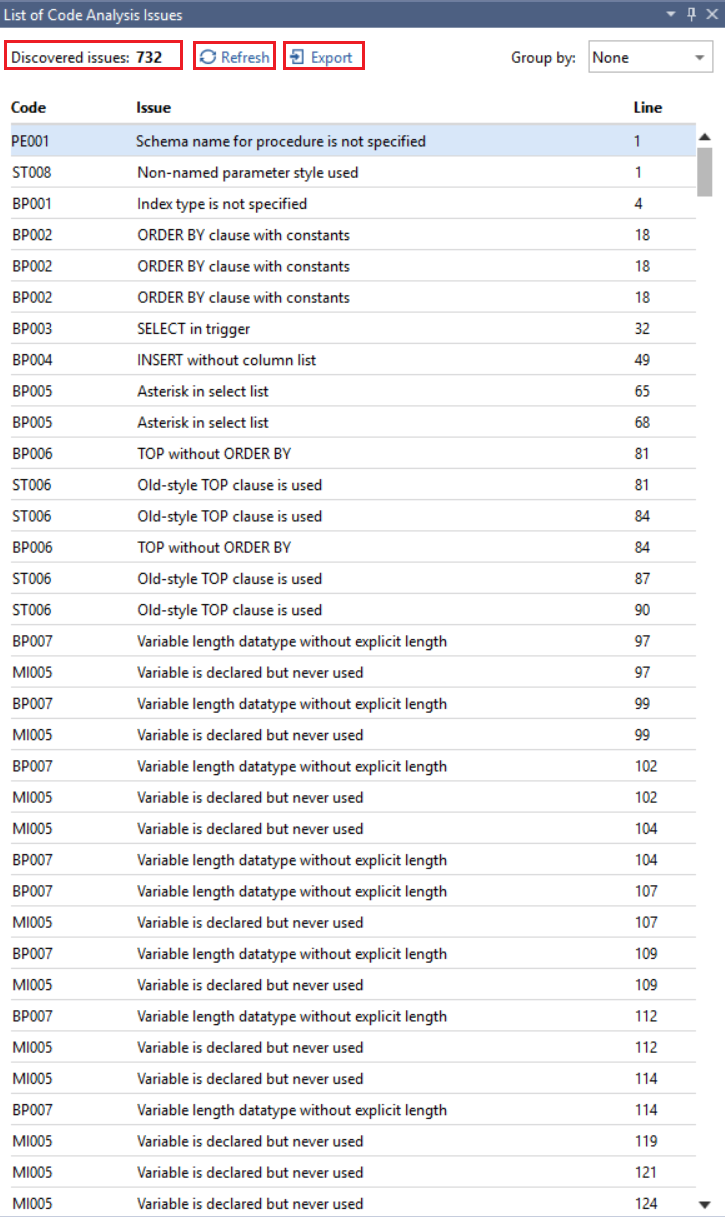
The List of Code Analysis Issues window is resizable and dockable, so you can have it displayed in whatever way you like. It displays all the issues that currently exist in your script, in the order that they appear in the code (sorted by issue line). The total issue count is shown at the top of the window. After you make a change in your script, you can refresh the list by clicking the Refresh button. You can also download the list of issues in the CSV format by clicking the Export button.
If you customise the List of Code Analysis Issues (e.g. by changing sorting, grouping or column order), the settings will persist when you close and reopen the window in the same IDE session, and also after you restart SSMS or Visual Studio. The window also retains its position and status (it remains docked, floating or tabbed).
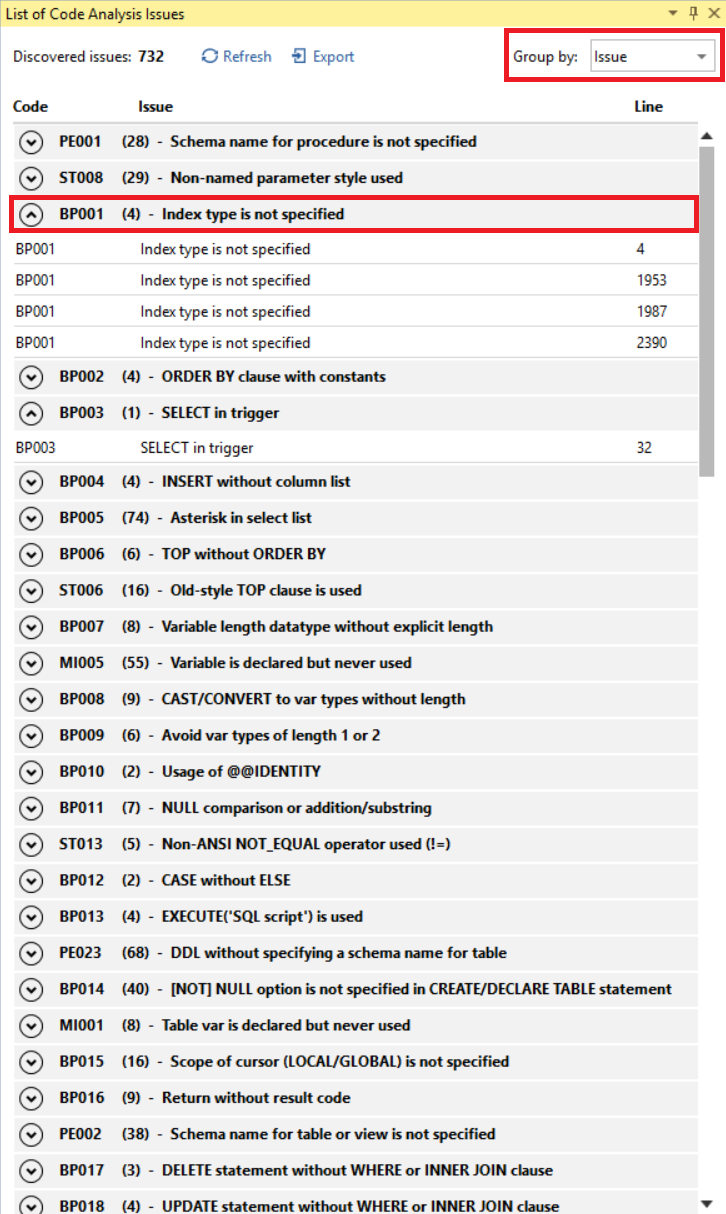
To display rules grouped by issue type (rule), simply select Issue from the Group by drop-down menu. You will see the list of all issue categories that exist in your script. The number in parentheses indicates how many issues of a particular kind are present. To display all the issues of a particular category, just click the category to expand it.
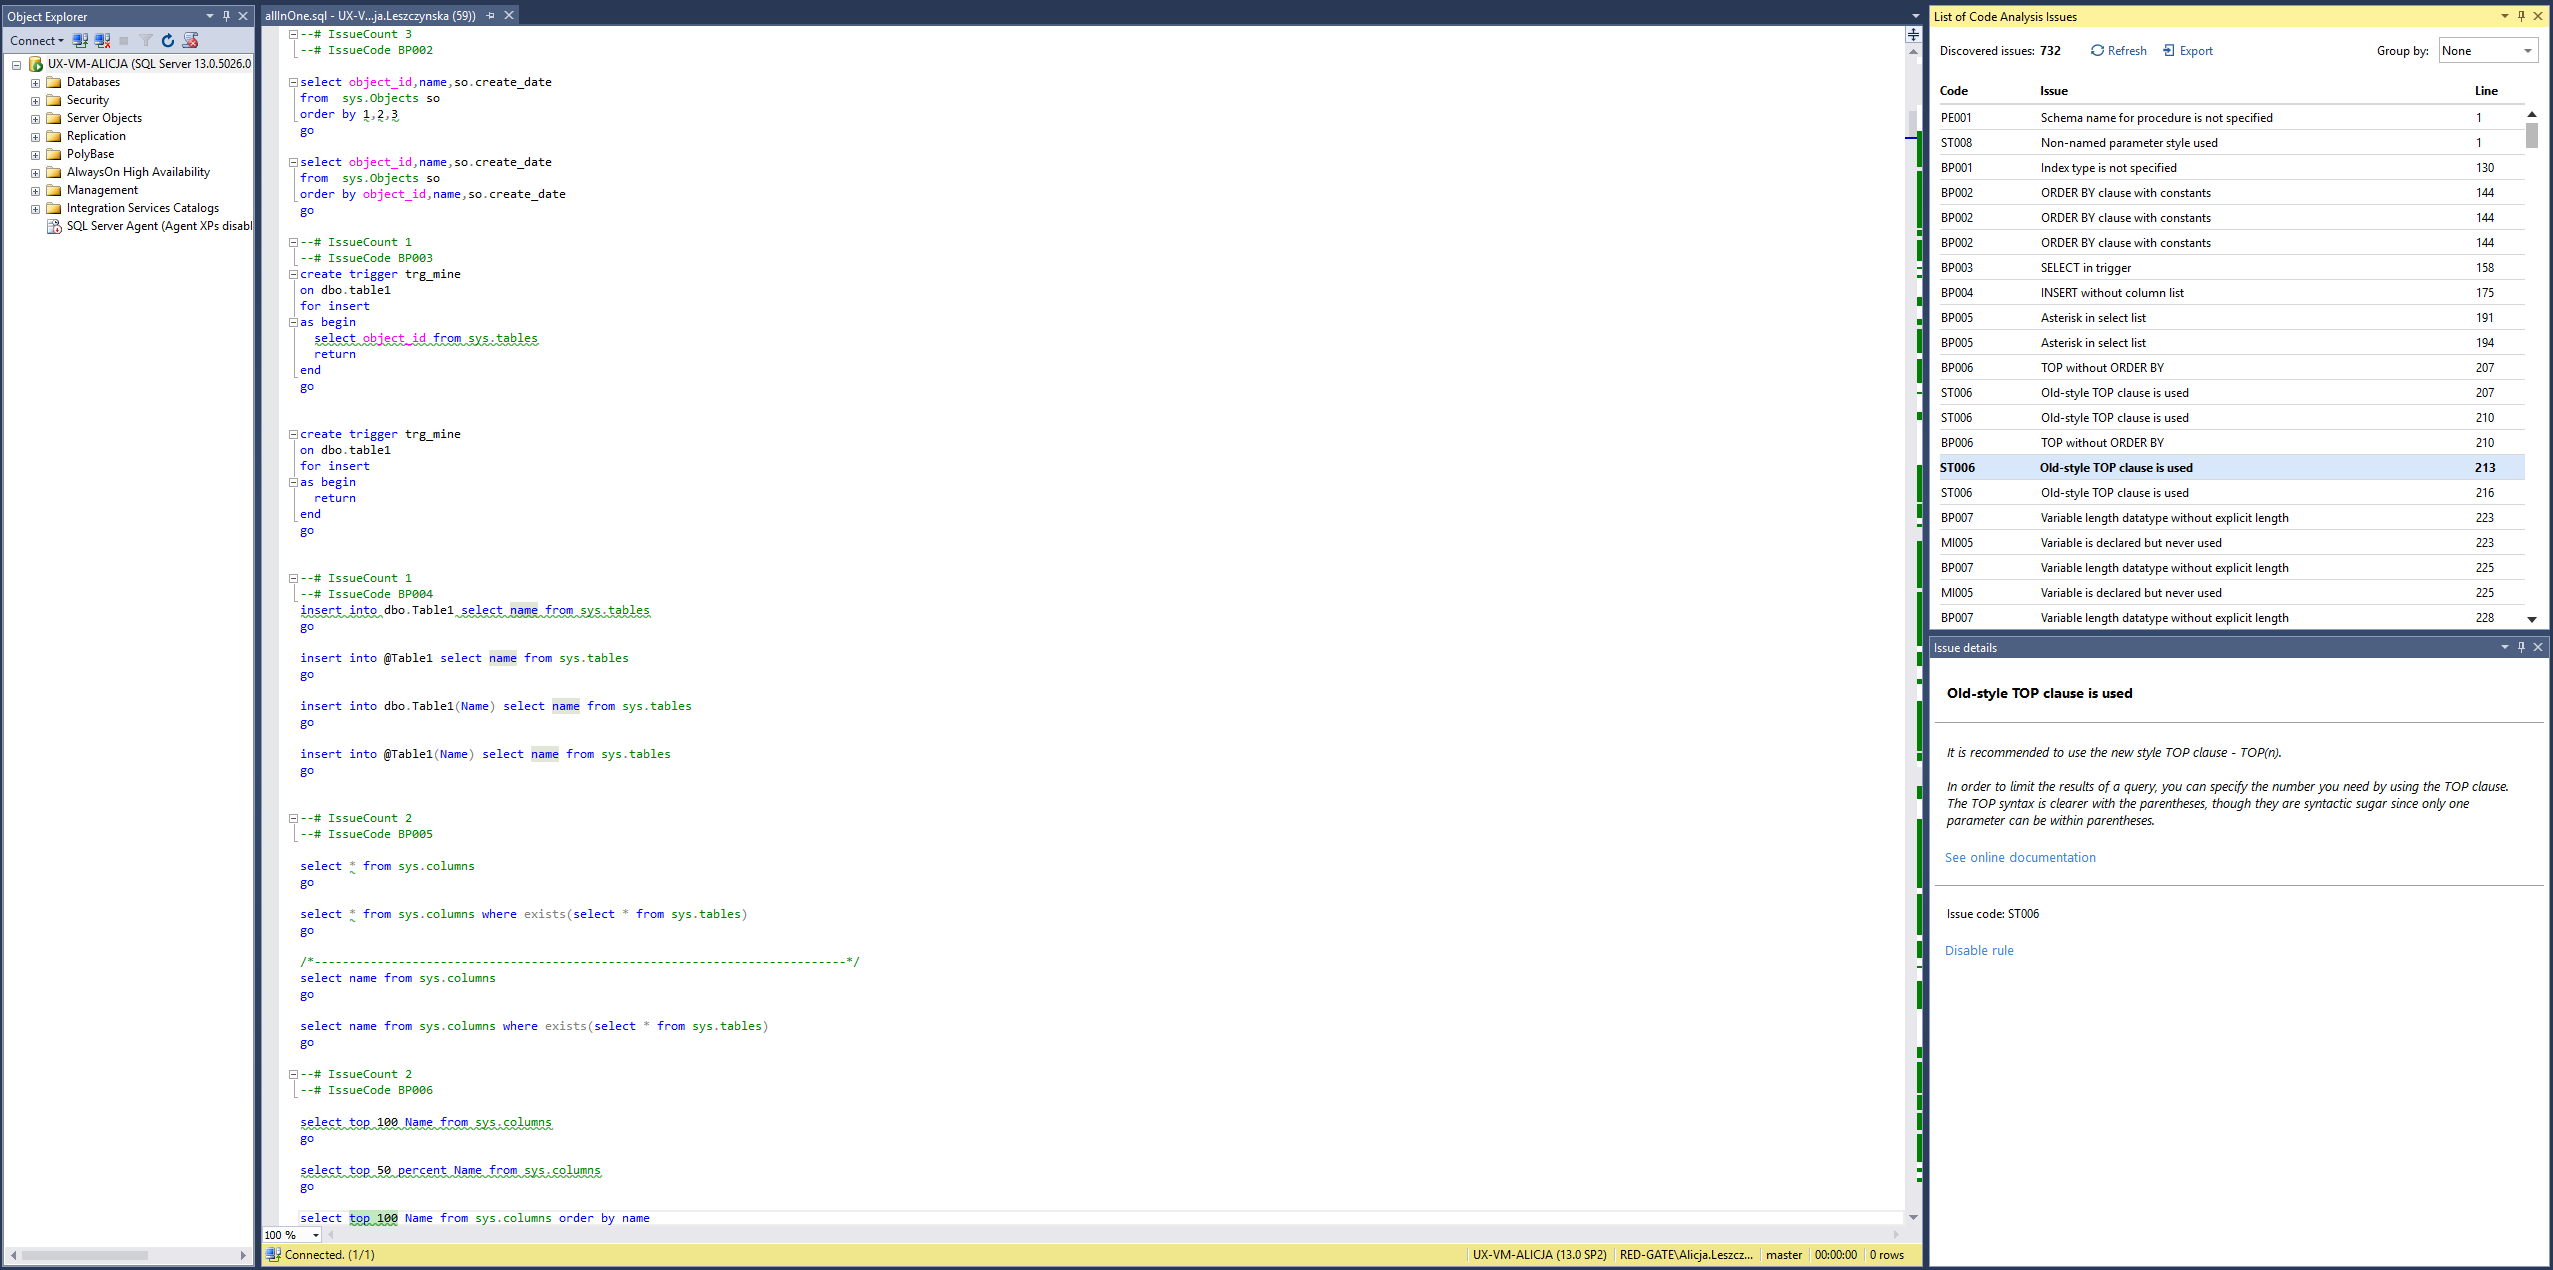
To see where a particular issue in the list is located in the code, double-click the issue. Your code editor will jump to the relevant position in your script and the issue will become highlighted in green. The currently highlighted issue is also displayed in bold in the issue list, and the issue details pane will display the details of the newly selected issue.
If you have the Issue Details window open as well, double-clicking an issue in List of Code Analysis issues will update the content of Issue Details to display the information about the issue that was double-clicked.
This documentation contains proprietary information and is protected by copyright law.
Copyright © 2026 Red Gate Software Limited. All rights reserved


