Profiling a Silverlight application
Published 14 December 2012
You can only profile Silverlight 4 or later applications. Profiling Silverlight applications requires the Silverlight 4 (or later) Internet Explorer plugin.
ANTS Memory Profiler 7 only supports Silverlight 4 applications.
To profile a Silverlight application:
- If your application runs in a browser, use Task Manager to kill all running iexplore.exe processes.
This makes sure that ANTS Memory Profiler attaches to the right iexplore.exe process. - Start ANTS Memory Profiler. If it's already running, on the File menu, click New Profiling Session.
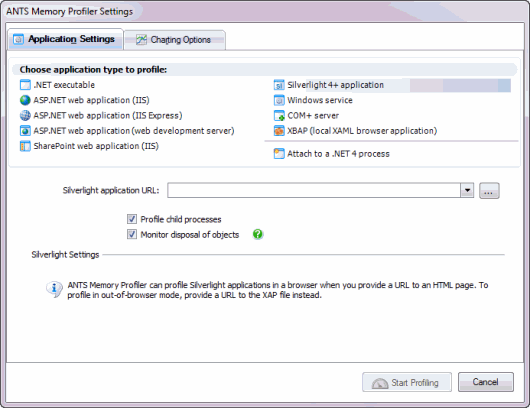
- Under Choose application type to profile, select Silverlight 4+ application.
- If your application runs in out-of-browser mode, next to Silverlight application URL, enter:
- A local path to the XAP file
- A URL (pointing to localhost) of the XAP file
- A local path to the file that embeds the application
A URL (pointing to localhost) of the file which embeds the application
ANTS Memory Profiler 7.4 only
When profiling Silverlight browser applications, you cannot navigate to your source code using the Visual Studio add-in. See below for how to configure your application and profiling session to work with the add-in.
- You should normally leave Profile child processes and Monitor disposal of objects selected, although monitoring the disposal of objects may affect the performance of your application.
- If required, change the performance counters to record.
- Click .
- Check whether there are any memory problems.
If you have problems, see Silverlight out-of-browser profiling stops with no results or Silverlight in-browser profiling stops with no results.
Navigating to Silverlight source code
This section only applies to ANTS Memory Profiler 7.4.
If you profile a Silverlight application that runs in a web browser, you cannot switch to view your source code using the ANTS Performance Profiler Visual Studio Add-in. To navigate to your source code, configure your Silverlight application to run in out-of-browser mode, and profile the Silverlight launcher application:
- In Visual Studio, open the application's Project Settings and select Enable running application out of browser.
- Start ANTS Memory Profiler. If it is already running, on the File menu, click New Profiling Session.
- On the ANTS Memory Profiler Settings dialog box, on the Application Settings tab, select .NET executable.
- In .NET executable, set the path to sllauncher.exe - e.g. C:\Program Files (x86)\Microsoft Silverlight\sllauncher.exe
- In Startup Options, set the Working directory to the directory containing your Silverlight application.
In Arguments, set the /emulate and /originswitches to the path of the Silverlight application - e.g.
/emulate:"D:\Dev\SilverlightApplication1\BinRelease\SilverlightApplication1.xap"

/origin:"D:\Dev\SilverlightApplication1\Bin\Release\SilverlightApplication1.xap"
- Click Start Profiling.
A new profiling session starts, and you can navigate to your source code from profiling results, using the Visual Studio add-in.


