Profiling XBAPs
Published 17 December 2012
The procedure for profiling XBAP applications depends on whether your application is locally or remotely-hosted.
To profile an XBAP application, Internet Explorer must be set as your default browser and it must be closed before profiling.
To profile a locally-hosted XBAP application
- Start ANTS Memory Profiler. If it is already running, on the File menu, click New Profiling Session...
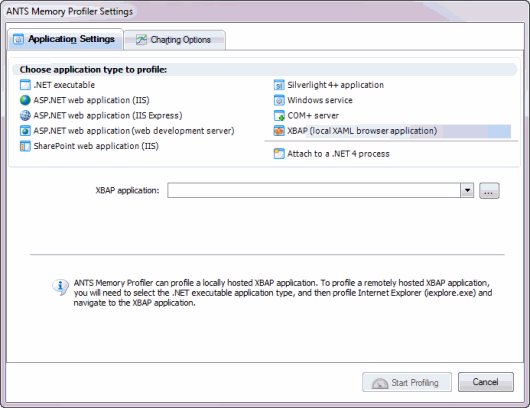
- On the ANTS Memory Profiler Settings dialog box, on the Application Settings tab, select XBAP (local XAML browser application).
- Enter the path to the XBAP application that you want to profile.
- You should normally leave Profile child processes and Monitor disposal of objects selected, although monitoring the disposal of objects may impact the performance of your application.
- If required, change the performance counters to record.
- Click .
- Check whether there are any memory problems.
To profile a remote XBAP application
- Start ANTS Memory Profiler. If it is already running, on the File menu, click New Profiling Session...
- On the ANTS Memory Profiler Settings dialog box, on the Application Settings tab, select .NET executable.
- Enter the path to Microsoft Internet Explorer (iexplore.exe).
- You should normally leave Profile child processes and Monitor disposal of objects selected, although monitoring the disposal of objects may impact the performance of your application.
- If required by your application, specify its Working directory. By default, the directory containing the .NET executable is used.
- If required by your application, specify any Arguments which should be supplied to the .NET executable at launch.
- If required, change the performance counters to record.
- Click .
- When Internet Explorer starts, navigate to the XBAP application and interact with it in the normal way.
- Check whether there are any memory problems.


