Profiling an executable
Published 14 December 2012
- Start ANTS Memory Profiler. If it is already running, on the File menu, click New Profiling Session...
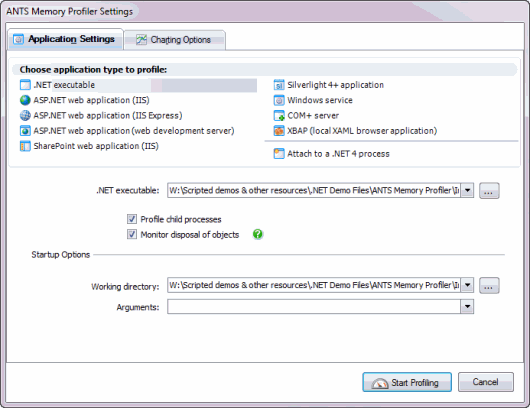
- On the ANTS Memory Profiler Settings dialog box, on the Application Settings tab, select .NET executable.
- Enter the path to the .NET executable that you want to profile.
- You should normally leave Profile child processes and Monitor disposal of objects selected, although monitoring the disposal of objects may reduce the performance of your application.
- If required by your application, specify its Working directory. By default, the directory containing the .NET executable is used.
- If required by your application, specify any Arguments that should be supplied to the .NET executable at launch.
- If required, change the performance counters to record.
- Click Start Profiling.
- Check whether there are any memory problems.


