Profiling COMplus servers
Published 17 December 2012
Before you start
To profile a COM+ server application correctly, set the ApplicationActivation attribute as follows:
[assembly: ApplicationActivation(ActivationOption.Server)]
If you cannot set this attribute (for example, if you do not have access to the source code), or if you set it to ActivationOption.Library, you may still be able to profile the COM+ application by profiling the client application. You should note, however, that the resulting server application:
- will not be a true COM+ application and will run in the client process
- will be treated by ANTS Memory Profiler as a DLL invoked by the client.
Also, you may need to make the application's code fully trusted by setting the ApplicationAccessControl attribute as follows:
[assembly: ApplicationAccessControl(false)]
You should not normally release the COM+ application in this trusted state.
Profiler settings
- Start ANTS Memory Profiler. If it is already running, on the File menu, click New Profiling Session...
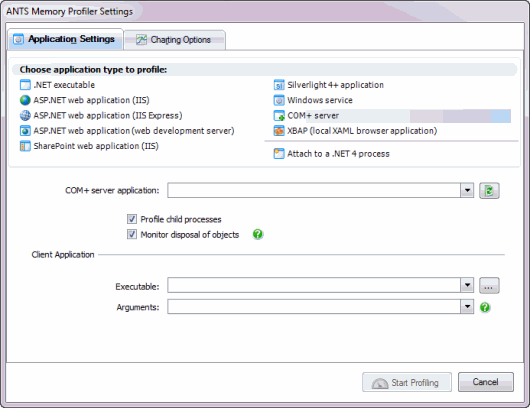
- On the ANTS Memory Profiler Settings dialog box, on the Application Settings tab, select COM+ Server.
- Next to COM+ server application choose the COM+ server application from the dropdown list. Click the icon to refresh the list, for example, if you have started the server since the ANTS Memory Profiler Settings dialog box was displayed.
- You should normally leave Profile child processes and Monitor disposal of objects selected, although monitoring the disposal of objects may impact the performance of your application.
- Under Client application, next to Executable, choose the path to the client application.
- If required, specify any Arguments required by the client application.
- If required, change the performance counters to record.
- Click .
- Use the client application to test the COM+ server application during your profiling session.
- Check whether there are any memory problems.


