Profiling .NET Core applications
Published 06 August 2018
Profiling .NET Core applications allows you to configure more run-time options than a basic .NET executable. You can specify a URL if profiling a web application, the relevant launch options, and choose a profiling mode and performance counters.
This article steps through both processes and explains the additional options you can choose.
Basic profiling
To profile a .NET Core application:
- From the list of application types, click .NET Core application.
Type or browse a path to the .NET core assembly that you want to profile.
You can use the dropdown list to select a recently-profiled application.
You can either choose an assembly (.dll file) or a project (.csproj, .vbproj or .fsproj file).- To set additional options, click Show startup options.
- If you need to pass any arguments to the application type them in the Command line arguments field.
- The Working directory is the path where the application will start. By default, this is the directory where the project file is located (if found), or the directory where the executable is located.
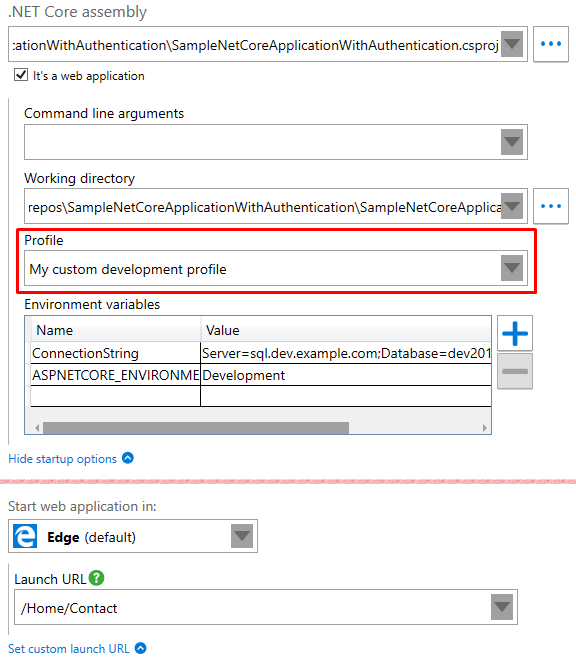
- When profiling a project, a Profile selector will appear. It contains run-time environments defined in launchSettings.json file.
- If you need to you can set any number of Environment variables that will be set before running the application.
One of the standard .NET Core variables isASPNETCORE_ENVIRONMENTwhich defines a target environment for a launched application (e.g. Production, Staging or Development). Similarly to command-line arguments, you can define your own environment variables and read them in your application.
Select the required Profiling mode, Chart performance counters, and Additional profiler options
For more information, see Choosing application types and settings and Setting up chart performance counters.
- Click
Profiling a Web Application
This section describes directly profiling ASP.NET Core executables.
You can also profile .NET Core web applications running on IIS or running on IIS Express.
Profiling a .NET Core Web Application is very similar to profiling any other type of .NET Core application. There are however a few important differences described below.
- When choosing a web application assembly or a project file, the profiler will recognize it and option will be selected.
- When option is selected:
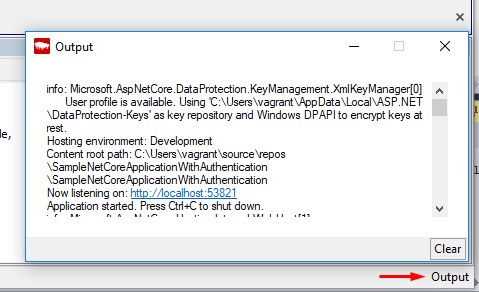
- Any console output (such as incoming requests) will be redirected to a built-in Output window.
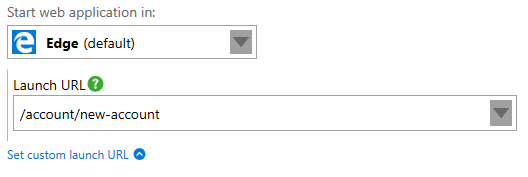
You can access this window by clicking Output button in the bottom-right corner of the profiler window: - You can choose a web browser in which your application will be launched and set a custom Launch URL to be opened in that browser:
If the field is empty, a web browser will open the URL the application is listening on.
If the field has a relative URL, it will be appended to the URL application is listening on.
If the field has an absolute URL, this URL will be opened in the web browser.
For example, if you want to focus on profiling a registration form on your website, you can type/account/new-account.
- Any console output (such as incoming requests) will be redirected to a built-in Output window.
During a profiling session you can interact normally with your web application and with the profiler.
When you have finished interacting with your web application, click the button in ANTS Performance Profiler to stop profiling.
Closing your browser window will not cause profiling to stop.
Profiling a project file
You can choose a project file (such as .csproj, .vbproj or .fsproj) to be profiled.
If you choose a project file, your application will be automatically rebuilt if it is out-of-date before it is started. Choosing a project also allows you to pick an application profile.
When the project file is selected a launchSettings.json file is read from your project's Properties folder. One of the settings stored in this files are Profiles.
A profile is a set of run-time settings. Essentialy, it defines an environment in which the application is run. For each profile you can set different command-line arguments, working directory, environment variables and launch URL.
Profiles can be defined manually in /Properties/launchSettings.json file or using Visual Studio in Project properties on Debug tab.
For example, when the My custom development profile was selected, values in related fields changed as defined in that profile:
(click on the image to enlarge)
Troubleshooting
My web application is taking a long time to launch
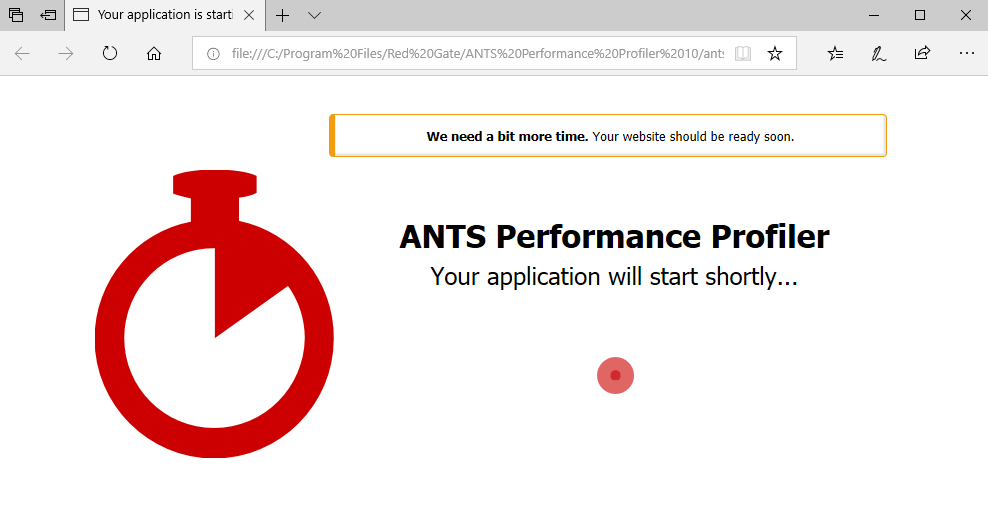
When profiling a .NET Core web application your web browser will be launched immediately. However, your application may take up to 30 seconds to start. While waiting you'll see our "Loading in progress" page.
.NET Core itself needs time to set up and launch a server hosting the application. Also, the first request to the application will usually take more time.
If you're profiling a project file this may take even more time (depending on its size and existing dependencies), as the project needs to be built.
You can see the current progress by clicking an button in a bottom-right corner of the profiler.
In the browser I can see "Fatal error. It looks like the profiling session has ended unexpectedly."
If there's any exception in your application when building a web host, it will prevent it from running.
Usually it's due to incorrect configuration or the application URL already being in use.
The actual reason will be visible in the Output window inside the profiler. To open it, click on the blinking button.


