Tracked queries
Published 28 March 2024
Top queries displays the most expensive queries that have run over the period indicated by the focus window at the top of the server overview page. If a query hasn't run within the focus window that has been selected, or it hasn't been selected as expensive enough it will not appear in the top queries section. There might be a need to monitor a specific query over time, and the top queries section might not meet the need for this. The tracked queries tab will let you have a specific view for the queries you need to monitor more closely, have a more concise list of important queries and will always collect data for your tracked queries even if the queries are not appearing in top queries tab when they are running.
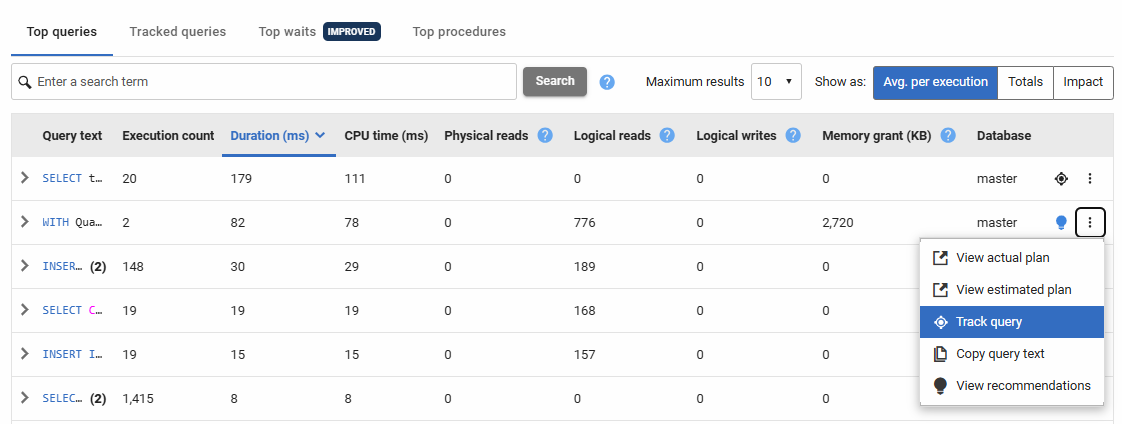
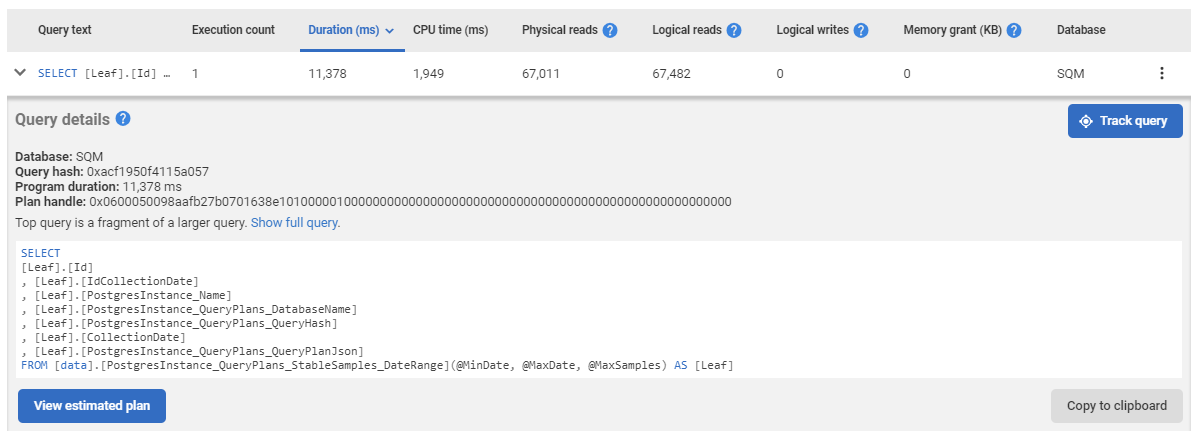
In order to track a query, you can either click on track this query option from the context menu available on top queries table on each row, or you can click the track query button available in the expanded view of each query. Once a query is tracked, both the context menu option and the track query button will change to stop tracking the query, which then can be used to stop tracking corresponding query. At the moment, users who are administrators can track and stop tracking queries. All other users are able to see the tracked queries without the ability to track or stop tracking any.
Context menu option:
Expanded view button:
Once tracked, queries will have an icon on the corresponding row to indicate that they are being tracked and from then on the queries will be visible on the tracked queries tab unless you stop tracking them. When you have reached the limit of the number of queries you can track, you will not be able to track more queries until you stop tracking some of the existing ones.
The tracked queries tab has all the metrics and capabilities the top queries tab has, as can be seen on the screenshot above. The queries in this tab are also subject to focus window as top queries are, the difference being if the query has not run in the focus window selected, it will still be visible on the table but without any metrics available.
Greyed out queries with query text displayed are ones that have not occurred in the focus window specified by the server overview activity graph.
Purged queries, i.e. ones that have fallen out of the data retention period, are shown here too, but very little data about them can be displayed as all of their data is gone. They can be untracked here, or you can leave them on. If they are ever rerun their data will be picked up and display by tracked queries again.
The tracked queries are subject to the same data retention settings as top queries; but when a query is tracked, Redgate Monitor will always collect the data for it, even if the query doesn't have significantly high metrics. This means if there are tracked queries, Redgate Monitor might be collecting more data then usual. Unless the queries are untracked, the data for them will continued to be collected even if they aren't significant. There is a limit of 100 tracked queries per instance, keeping the list concise and easier to work with and minimizing the increase in storage usage.


