Investigating Blocking using SQL Monitor
Published 21 October 2021
Blocking occurs when one or more sessions request a lock on a resource, such as a row, page or table, but SQL Server cannot grant that lock because another session already holds a non-compatible lock on that resource, forcing the requesting sessions to wait. Locking, and the blocking it causes, is usually fleeting and is a normal operational characteristic of a database. However, if our database transactions hold locks for extended periods, blocking can become a problem that reduces the responsiveness of SQL Server and degrades the performance of many user processes.
When severe blocking occurs, the goals are:
- Identify the "head blocker" - its SPID, along with details of the process and user that are running it. SQL Monitor provides all these details
- Investigate the underlying cause – who and what issued the blocking statement and what is it doing?
- Resolve the blocking problem. In the immediate term, this might mean killing the blocking process, if you're certain it's safe to do so. In the longer term, you need to fix the underlying problem to prevent recurrences.
Identify the Head Blocker
SQL Monitor samples blocking information every 15 seconds, from the Dynamic Management Views. When it detects significant blocking, it reports all the details in the blocking processes table, including a graph of the full blocking chain. SQL Monitor will also, by default, raise the blocking process alert against any SQL process that has been blocking one or more other processes for longer than a specified duration. Either of these sources should give you enough information to identify the cause of excessive blocking, without the need to set up an Extended Event session to collect the blocked process report event, or to use an external tool.
The following screenshot shows a blocking process alert, marked on the activity graph on the Server Overview page for a demo SQL Server instance. You can see a blocking process alert marked on the timeline, within the context of what was happening on instance at the time. The alert details are shown in the right-hand panel and the Blocking processes table is lower down the page.
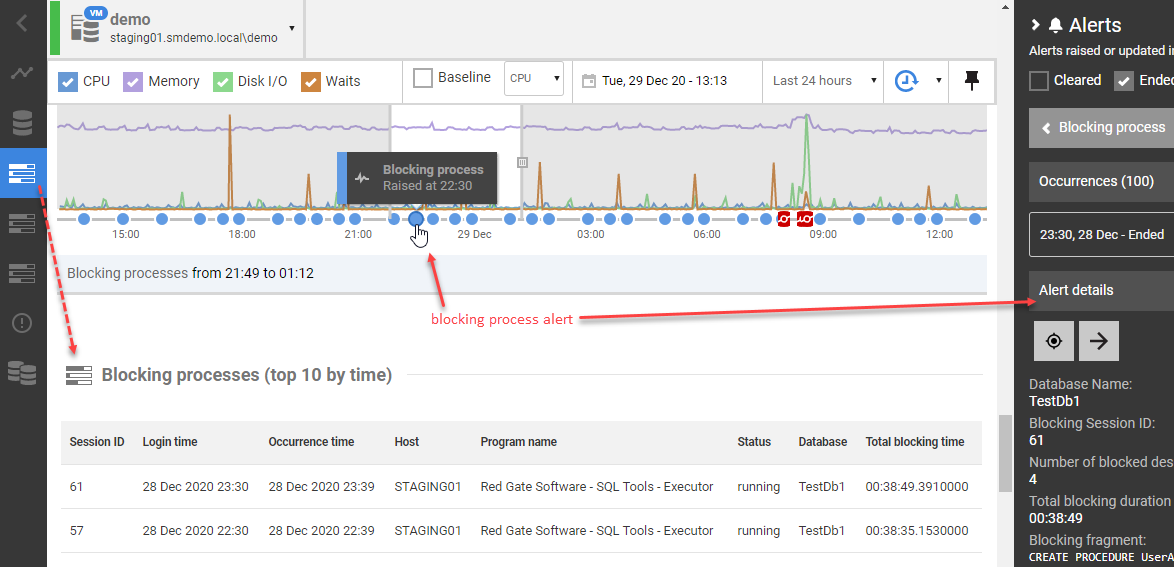
Blocking process alert
By default, SQL Monitor raises a Low severity blocking process alert when blocking exceeds 1 minute but, as with any alert in SQL Monitor, you can adjust the threshold and set multiple levels of alerts for different thresholds.
The alert details immediately reveal the database involved, the session ID of the head blocker, the SQL text executed by the blocking session, and the identity of who or what issues the blocking statement. The Processes tab of the alert details section shows the blocking chain, captured from sys.dm_exec_sessions, giving full details of the head blocker and with each blocked session in the chain displayed, indented, below it.

SQL Monitor also provides as contextual information, in the alert details, all sorts of snapshots, aggregations and summaries of resource usage on the server around the time of the alert.
Blocking processes (Top 10 by time)
If significant blocking has occurred over the period of investigation, the head blocker will appear in the blocking processes table, on the Server Overview page for that instance, along with a graphical depiction of the blocking chain.
This table displays useful data from the sys.dm_exec_requests and sys.dm_exec_sessions dynamic management views including the SPID of the head blocker, the name of the program that issued the process, the total blocking time, and the status of the blocking process (running, sleeping, rolling back).
If you click on one of these blocking processes, you'll see the blocking graph with all affected processes, along with the details of which application issued each process, what resource it was waiting to acquire, the SQL text it was executing, and more. For each process, you can view it cached query plan, to look for any obvious signs of what might be the cause of the blocking.

Investigate the underlying cause
At this stage, you've identified the head blocker, from the blocking processes table or blocking process alert. In an emergency, you could simply remove the blockage, which could be as simple as killing the process (SPID) running the head blocker, assuming that's permissible.
However, this will not fix the underlying problem. The next step will be to understand the underlying cause, so that you can make improvements to prevent or minimize recurrences. Your diagnosis will usually start with the head blocker and examining which application issued the blocking process, what it is executing, its status, and which tables and indexes it is accessing.
- Identify the application - may offer an immediate clue to the cause. For example:
reporting applications often issue long running reporting queries that block "writers" for long periods
database deployment tools, if running schema modifications, will block all access to the affected tables for the duration.
2. Check the status of the head blocker.
If it is running, check for any wait type listed for the process in the blocking graph. It will not be waiting for a lock but may be waiting for some other resource, such as IO, which may indicate that it's an IO-intensive process that is blocking many other sessions for long periods, so you'll need to investigate and resolve the IO bottleneck.
If it is sleeping, then the cause is likely to be an application timeout where the query being issued failed to roll back correctly, so still holds locks. Alternatively, it could be a problem caused by a connection or application failure while rows were being fetched.
You can find common blocking scenarios and resolutions in the Microsoft documentation.
3. Analyze the SQL command and query details – for the head blocker, including the SQL text and the tables and indexes involved.
For example, look out for scans of very large tables, including possible reasons why existing indexes were apparently ignored, such as due to non-SARGable predicates. You may be able to improve indexing, or rewrite queries, so that the SQL command processes fewer rows more efficiently.
4. Review the full blocking chain – reviewing the blocked as well as blocking processes and commands, lock requests and transaction isolations levels can give you a broader perspective of the causes of the blocking. For example:
Check the wait type listed for blocked processes – this usually indicates nothing more significant than the type of lock request that is blocked. However, if you see the LCK_M_IX wait type, and Top 10 waits also shows it as biggest wait type over the period, then it might indicate that the head blocker has caused lock escalation. It implies that the blocking process is reading many rows, or updating many rows, and SQL Server has escalated the IS or IX lock on the table to S or X. All subsequent modifications on this table will be blocked for the duration waiting to acquire an IX lock on the table. This might require tuning and indexing efforts to reduce the number of locks acquired and prevent escalation.
Range locks in the blocking chain indicates transactions using SERIALIZABLE isolation level, which acquire more restrictive locks and hold them for the duration for the transaction, causing more blocking problems. Cascading deletes will also, under the covers, escalate transactions to the SERIALIZABLE isolation level. If the blocking process is a SERIALIZABLE transaction, does it really need to use this mode? Is use of snapshot-based isolation a possible alternative?
Review other sources on the Server Overview page such as the Top 10 queries, and possibly the profile of wait types observed over a period of severe blocking, to understand to understand the broader pattern of activity and resource use on the monitored SQL instance.
Resolve the blocking problem
Sometimes resolving blocking may be as simple as rescheduling 'competing' readers and writers, such as rescheduling a schema deployment for an alternative time.
Often, resolving blocking often requires identifying and tuning inefficient queries and data modifications. Sometimes, queries run within explicit transactions when there is no real need for them to do so. Transactions need to be kept as short as possible, without compromising transactional integrity. Transactions that use elevated isolation levels, such as REPEATABLE READ or SERIALIZABLE without good cause, which will also exacerbate blocking problems.
Indexes may also help prevent blocking. For example, an update on a large table without indexes might have to scan the entire table, and hold a lock for the entire scan, whereas an update on a well-indexed table may be able to efficiently seek directly to the affected rows and so hold locks for much shorter periods.
Query tuning and indexing
There are two common activities for reducing, or even eliminating, blocking in SQL Server. First, check for opportunities to improve indexing either by adding missing indexes or improving existing indexes. Efficient indexing means fewer reads, faster queries, and less opportunities for blocking. Second, examine queries and eliminate any extra work.
If tuning queries or indexes is not possible, then try "separating heavy readers". In practice, this usually means moving problematic queries (often long-running reports) to a read-only copy of the database.
Optimize long running data modification transactions
Make data modification transactions shorter, by including in each transaction only those statements that absolutely must succeed or fail as a unit. When a transaction causes SQL Server to acquire exclusive locks, it holds them until the transaction ends. Shorter transactions mean exclusive locks are required for less time.
Schedule write-intensive operations carefully. Move heavy data modification to periods of low system utilization. This won't eliminate blocking, but it can reduce the impact on users.
- Useful references:
- The DBA as Detective: Troubleshooting locking and blocking provides good guidance, and a query to look for transactions holding lots of X/IX locks.
- Which locks count toward lock escalation – a useful examination of when lock escalation occurs. See also the lock escalation topic in the MS docs.
Switch to snapshot-based transactions
Use of the read committed snapshot isolation level is often an effective way to remove blocking problems in SQL Server, without needing to rewrite queries or the application. However, the biggest obstacle in many cases if that it may dramatically change how the application behaves. Any decision on changing isolation levels is likely an architectural decision for the application and needs to go back to the application developers. Also, bear in mind there will be an increase in tempdb usage.
When a snapshot-based isolation level is enabled, SQL Server stores in the version store, in tempdb, copies, or versions, of all the previously committed versions of any data rows. When a SELECT statement encounters a row on which another transaction holds an Exclusive (X) lock, to modify that row, then rather than block, it traverses the row version chain in the version store to reconstruct a ‘snapshot’ of the data, as it existed when the statement began (READ_COMMITTED_SNAPSHOT isolation) or transaction began (Snapshot isolation). So, for example, this allows RCSI to offer the same protection against dirty reads as the default READ COMMITTED level, but without the need for SELECT operations to acquire Shared (S) locks.
Consider use of READ_COMMITTED_SNAPSHOT isolation for queries that currently run in READ COMMITTED and are causing excessive blocking. This is a much better alternative than use of READ UNCOMMITTED isolation. You can also review statements involved in blocking that use elevated isolations levels such as REPEATABLE READ or SERIALZIABLE. Long running transactions using these restrictive levels will hold locks of longer and can cause blocking.
- Useful references:
Investigate application behavior that can lead to excessive blocking
Look out in the blocking processes table for blocking processes that are sleeping or rolling back. This sometimes indicates an application-level problem with queries not releasing locks when queries are cancelled, application timeout occurs, or connections are poorly managed or fail. See Application involvement in blocking problems in the Microsoft documentation for further details.
Optimize database deployments
SQL Monitor will automatically mark deployments made using other Redgate tools on it activity timeline. Using the PowerShell API, you can also notify of it deployments from other tools.
Deployment of schema changes will cause acquisition of Schema modification (Sch-M) locks, which block all other access to the table until the lock is released, and so can cause significant blocking. Often the best way to avoid such problems is to understand which deployments are liable to cause this blocking and to schedule them carefully. See It's a Lock: Due Diligence, Schema Changes, and You for more advice.
This documentation contains proprietary information and is protected by copyright law.
Copyright © 2026 Red Gate Software Limited. All rights reserved


