Downloading and managing error reports
Published 31 December 2012
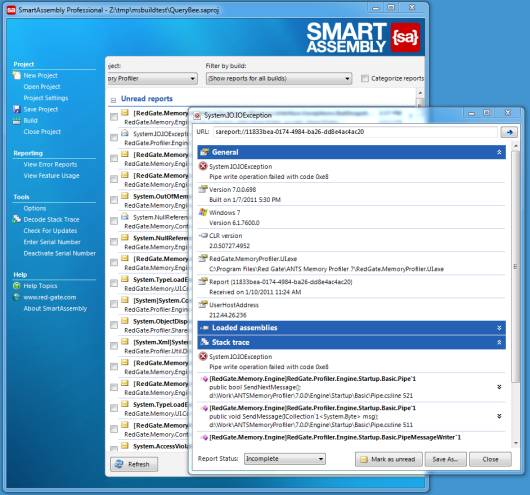
Viewing reports
To view a list of received error reports, on the menu bar, click View the Reports. The latest reports are downloaded from the server automatically and are added to the list of previously downloaded reports. Double-click a report in the list to display the full report.
Reports automatically include:
- The exception itself.
- The date and time that the exception occurred.
- The version of Windows the error occurred on.
- The user's host address.
- The version of the .NET Framework being used.
- Stack trace.
- A list of the loaded assemblies.
You can only store 1000 reports on the reports server. Since reports are deleted from the web server when you download them (either by clicking View the Reports or by using the command line interface), you should ensure that you download your reports regularly. For more information, see This application has submitted too many reports.
SmartAssembly is supplied with a set of sample error reports to help you learn about the information contained in error reports. These reports are in the Example Application project.
Because your error reports are identified by your SmartAssembly license key, error reports for your existing builds may stop working if you upgrade from SmartAssembly Standard to SmartAssembly Pro. For more information, see Upgrading SmartAssembly Standard to Professional.
Filtering reports by project
If you have built multiple projects with SmartAssembly but only want to see the error reports for one of them, select it from the Filter by project menu. Reports relating to other projects are hidden.
Filtering reports by build
When filtering reports by a project, you can choose to view only the report list for a specific build number. This is useful if you have recently fixed a bug and want to check that the exception raised by the bug is fixed.
Flagging reports
Flags are used to manage your reports. To apply a flag, either click the gray rectangle beneath the question mark or right-click on the report. How you use the flag color scheme is entirely up to you.
For example, you may choose to use a red flag to show that an error message relates to a major, newly-discovered bug and requires immediate attention. If an error is a known issue, you may want to mark it with a green flag. After flagging a report, the rectangle changes to the selected flag color.
You can filter the list to show only reports that you have flagged. To do this, on the Filter by project menu, select (All flagged reports). The reports are grouped according to the flag color and unflagged reports are hidden.
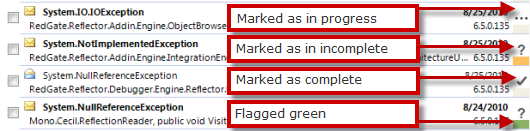
Marking reports
Reports are initially marked as 'incomplete' ( ). While you are working on an error report, you can mark it as 'in progress' (
 ) and after you have addressed the report, you can mark it 'complete' (
 ). Also, in a similar way to your e-mail application, you can manually mark reports as 'read' and 'unread'.
- To mark one report, either click the question mark (the 'incomplete' icon) or right-click on the report.
- To mark more than one report, select the reports using the checkboxes and then use the Mark selected reports menu.
To mark all reports which are currently shown, click Select all and then use the Mark selected reports menu. Only reports shown at that time are affected.
Any reports which are hidden because a filter is applied are not marked.
When you are viewing a full report, use the Report status: menu and/or Mark as (un)read button to mark the report
Categorizing reports
After filtering reports by project (and build number, if required), you can categorize reports. This groups the reports by the exception name. The number of reports in each category is shown next to the exception name. You can expand the category to show the reports that raised the exception.
Marking categories
You can mark categories as incomplete, in progress and complete in the same way as for reports. If you mark a category as in progress, the category is shown as 'Assigned to [your Windows username]'. If you mark a category as complete, the category is shown as 'Completed on [today's date]'.
Marking categories is independent of marking the reports that the category contains. If you mark a category as 'in progress', the reports in the category do not also change to 'in progress' automatically. This is because one exception may be caused by more than one different problem, so you should specify which individual reports you are working on.

Filtering by category status
You can use the Filter by category status menu to display only categories which are marked as Complete, In Progress or Incomplete.
Downloading new reports
To download any new reports, which have been received by the server since you started viewing the reports, click Refresh.
Storing error reports
Once downloaded, error reports are deleted from the web server.
- If you have installed SmartAssembly only on one computer, you can use SQLite database, by default stored in %PROGRAMDATA%\Red Gate\SmartAssembly 7\SmartAssemblySQLite.db. Any error reports can only be decrypted on this computer.
- If you use a Developer or Professional edition of SmartAssembly, the database is likely to be located on a SQL Server and shared between all clients. When a SQL Server is used, error reports can be decrypted on any computer with SmartAssembly installed.
SmartAssembly creates a public/private key pair to encrypt the reports in the SQL database and stores the private key in the database.
To change where error reports are stored, see Configuring reporting on multiple computers.
Deleting error reports
Error reports are deleted from the web server when you download them to store them in your SQLite database file or SQL Server database.
You can delete error reports from your SQLite database file or SQL Server database by selecting the checkbox next to the report in the report list and clicking Delete selected.
Troubleshooting error reports
- If you receive incomplete error reports containing the line 'This error report is incomplete because SmartAssembly was not able to retrieve the associated map', see About map files.
- If you see the error message 'The error report is not associated with a valid project ID', see The error report is not associated with a valid project ID.
This documentation contains proprietary information and is protected by copyright law.
Copyright © 2026 Red Gate Software Limited. All rights reserved


