Processes and databases
Published 17 August 2020
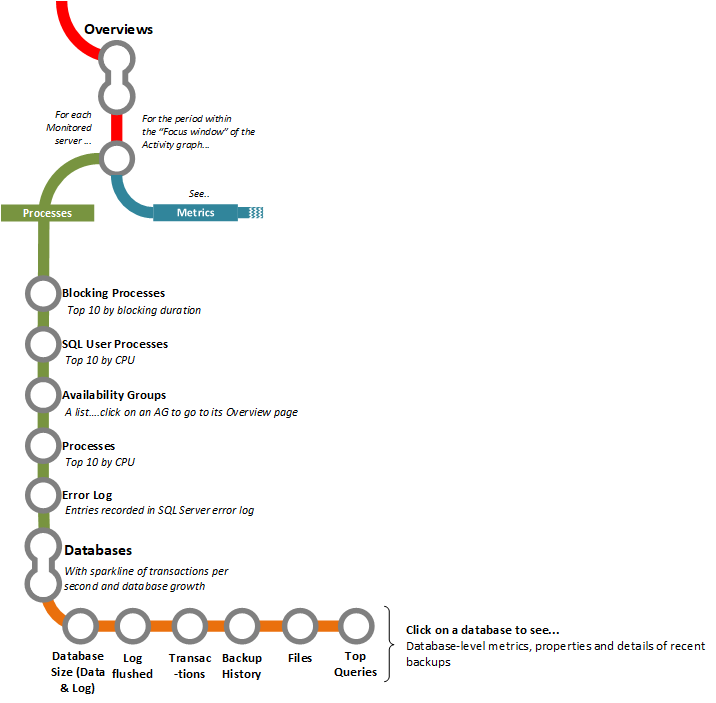
Blocking Processes
Information from the blocked process report. For each blocking process, you’ll see the full blocking chain, along with the details of which application issued the process, resources involved (tables, indexes, etc.), the SQL text being executed, and more. Blocking processes can raise the blocking process alert (see List of alerts for details).
For more information on troubleshooting blocking, see: Blocking Processes Overview.
SQL User Processes
Information from sys.sysprocesses identifying each user process, the program that issued it, % of CPU capacity it was using during that period, and how much I/O it performed.
Processes (Server)
Name of each server process, including WMI processes, how long it’s been running, and sparklines of its processor and memory use, over the period.
Availability Groups
There is also a list of availability groups (AGs) showing the status of each one. Click on an AG to go to its Overview page, revealing useful information on the status of the primary and available replicas and metrics such as log growth, the size for the send and redo queues, length of transaction delays and more.
See: Availability group overview for more details.
Error log
A list of any recorded errors from the SQL Server error log.
Databases
A searchable list of databases, with database-level attributes (name and availability) and a sparkline of transactions per second and database size for each one. If you click on a database, you'll see a whole range of database-level metrics, properties and details of recent backups.
Counters
SqlServer:Database-Performance (transactions, log activity).
Transactions/sec
Number of transactions started for the database per second. Each data point shows the average number of transactions per second since the previous data point.
Active transactions
Number of active transactions for the database. Each data point shows the number of active transactions at the point the data was collected.
Log bytes flushed/sec
Average size of the log flush per second. Each data point shows the average log bytes flushed per second for this database since the previous data point.
Log flushes/sec
Number of log flushes per second for this database, averaged since last collection time.
Log flush waits/sec
Number of transaction commits per second waiting to be flushed from the log cache to the physical transaction log file on disk.
SqlServer:Database-Storage (total file sizes and space usage for data and log files).
Total data file size
Total size of all data files (.mdf and .ndf files) for the specified database.
Total log file size
Total size of all log files (.ldf) for this database.
Total log space used
Total transaction log file size currently containing log records.
Database properties
A range of database properties as follows (with sample values taken from https://monitor.red-gate.com/):
Recovery model: | FULL |
|---|---|
Date created: | 2 Mar 2018 13:02 |
Collation: | SQL_Latin1_General_CP1_CI_AS |
Compatibility level: | 140 |
Auto create statistics: | True |
Page verify: | CHECKSUM |
Auto shrink: | False |
Recent Backup History
Shows the most recent backup of each type. It shows all backups taken in the period indicated by the focus window of the activity graph, and then the most recent backup of each type taken previously.
The backups page on the estate tab shows full details of all backups across your whole estate.
Files
Details of the database files as follows (with sample values taken from https://monitor.red-gate.com/):
Name | Type | Filegroup | Path | Space used | Current size | Percent Used | Autogrowth | Max size | Time until full |
CommunityServer_Data | Rows | PRIMARY | E:\MSSQL\Data\CommunityServer_Data.MDF | 1,536.4 MB | 2,000.0 MB | 77% | 1,000.0 MB | Unlimited | |
CommunityServer_Log | Log | F:\MSSQL\Log\CommunityServer_Log.LDF | 42.9 MB | 4,204.0 MB | 1% | 500.0 MB | Unlimited | > 5 years |
Recent top queries
See Top 10 queries for details.
This documentation contains proprietary information and is protected by copyright law.
Copyright © 2026 Red Gate Software Limited. All rights reserved


