Blocking Processes overview
Published 17 August 2020
SQL Monitor allows you to look into historical and current details of the Top 10 Blocking Processes for each server and the processes that they have blocked, where the top 10 processes are selected according to the total amount of blocking time that they have caused. You can now view that information in tabular form and then dive deeper by exploring our visualization of the blocking chain.
See the Redgate University Blocking Processes video demo of how to use the "Blocking Processes (Top 10 by time)" feature.
Blocking Processes table
The Blocking Processes table is available from the Server Overview page. Each row represents a blocking process, containing information about it, Session ID, Login Time, Host, Program Name, Status, Database and Total blocking time, as shown in the image below.

Total blocking time
Total blocking time is the sum of time that other processes have waited because of the blocking process at a particular point in time. For example, if at 17:30:31 process A has reserved a resource which is also needed for process B, and by that time process B has been waiting for that resource for 56 seconds, the Total Blocking Time will be 56 seconds. If another process, process C, has also been waiting for a resource reserved by process A for 31 seconds, by 17:30:31, then the Total Blocking Time will be 31 + 56 = 87 seconds.
Blocking process tree
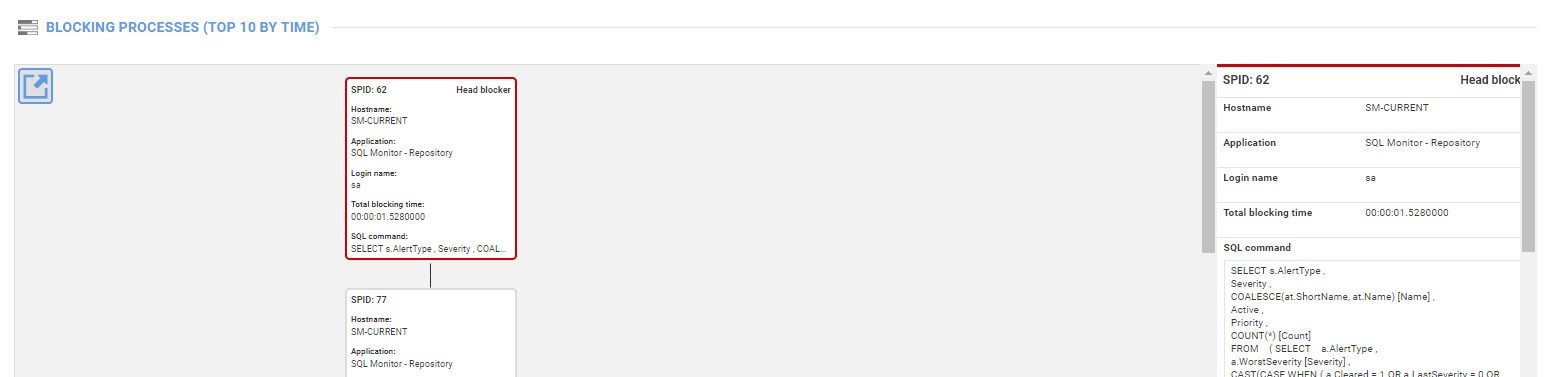
Users can click on each row in the Blocking Processes table in order to get a Blocking Tree, which shows the head blocking process as the head node (highlighted red), with the processes blocked by it as the children nodes.
As blocked processes can also block other processes, they can contain their own children, forming the tree-structure shown in the image below. Each node also contains information about each process similar to what is displayed in Blocking Processes Table, such as Hostname, Login name, Application.
See the Troubleshooting Blocking in SQL Server using SQL Monitor product article to understand how to use SQL Monitor's metrics, alerts and performance diagnostics to investigate query performance problems caused by excessive blocking.
This documentation contains proprietary information and is protected by copyright law.
Copyright © 2026 Red Gate Software Limited. All rights reserved


