Profiling on web development server
Published 14 December 2012
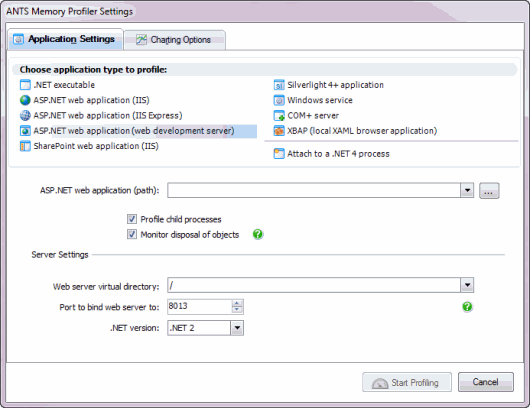
To profile ASP.NET applications running on the web development server, on the ANTS Memory Profiler Settings dialog box, perform the following steps:
- Start ANTS Memory Profiler. If it's already running, on the File menu, click New Profiling Session.
- Under Choose application type to profile, select ASP.NET web application (web development server).
- In the ASP.NET web application (path), browse to your application.
- Normally, you'll want to keep Profile child processes and Monitor disposal of objects selected, but this can affect your application's performance.
- In the Web server virtual directory box, enter the virtual directory where your application will start.
- In the Port to bind web server to box, select the port where your application will start.
For example, if the virtual directory is staging and the port is 8013, the URL profiled will be http://localhost:8013/staging/ - Specify the .NET version which the web application is compiled against.
- Click .
- Check whether there are any memory problems.


